Core concepts
Tokenomics & Emissions
Distribution
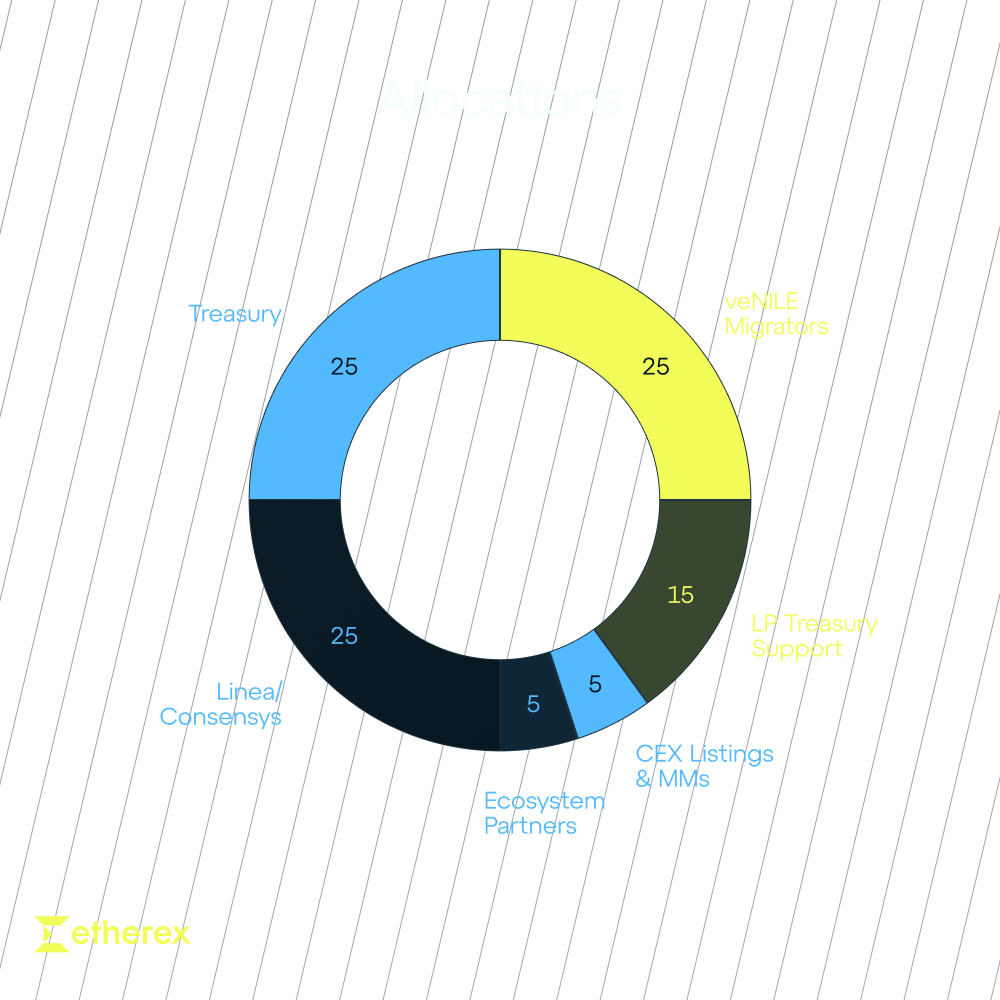
Below is the initial distribution of REX.
Breakdown
| Token Distribution | Amount |
|---|---|
| Treasury | 87,500,000 |
| Linea/Consensys | 87,500,000 |
| veNILE Migrators | 87,500,000 |
| LP Treasury Support | 52,500,000 |
| CEX Listings & MMs | 17,500,000 |
| Ecosystem Partners | 17,500,000 |
| Total Supply | 350,000,000 |
Most allocations are in xREX except for LP Treasury Support and CEX Listings & MMs which are REX.
Emissions
Below is an approximation of our weekly emissions (before elastic emissions) vs. total supply for the first 500 Epochs (~10 years):
Emissions vs. Supply
- Initial supply: 350M tokens
- After 10 years (520 epochs): ~683M tokens total supply
- Maximum supply cap: 1 Billion tokens
Epoch 0: 3.5M weekly emissions
Epoch 1: 20% increase
Epoch 2: 10% increase
Epoch 3: 9% increase
Epoch 4: 16% decrease
Epoch 5: 25% decrease
Epoch 6+: 1% decay per epoch in perpetuity without intervention
Total supply asymptotically approaches 1B tokens
Elastic Emissions
Emissions can be modified by up to ±25% per epoch depending on protocol revenue to maintain sustainable inflation. 100% of ALL emissions go to gauges—there are no team allocations or other distributions, ensuring fully decentralized emissions.
When Revenue is >= Emissions for multiple epochs in a row, or if upcoming catalysts for revenue increase are soon coming.
When Revenue is <= Emissions substantially for multiple epochs in a row, or if upcoming catalysts for revenue decrease are expected.
Note: These are approximate projections and actual emission numbers may vary. This model demonstrates our commitment to sustainable, long-term supply growth.